Are younger generations poorer than their parents were at the same age?
brief · 2026-05-03 · Lifetime Cohort Wealth Ratio · open for all
Across most developed economies, the cohort born in 1985 has accumulated meaningfully less real net wealth at age 35 than the cohort born in 1955 had at the same age. The gap ranges from roughly 15% in Germany to over 50% in Japan. This brief sets out the headline read; the full methodology and bias audit sit behind it.
The headline chart
The Lifetime Cohort Wealth Ratio (LCWR) compares each birth cohort's real net wealth at a given age against an earlier cohort's wealth at that same age. A ratio below 1.0 means the younger cohort is behind where the older one stood.
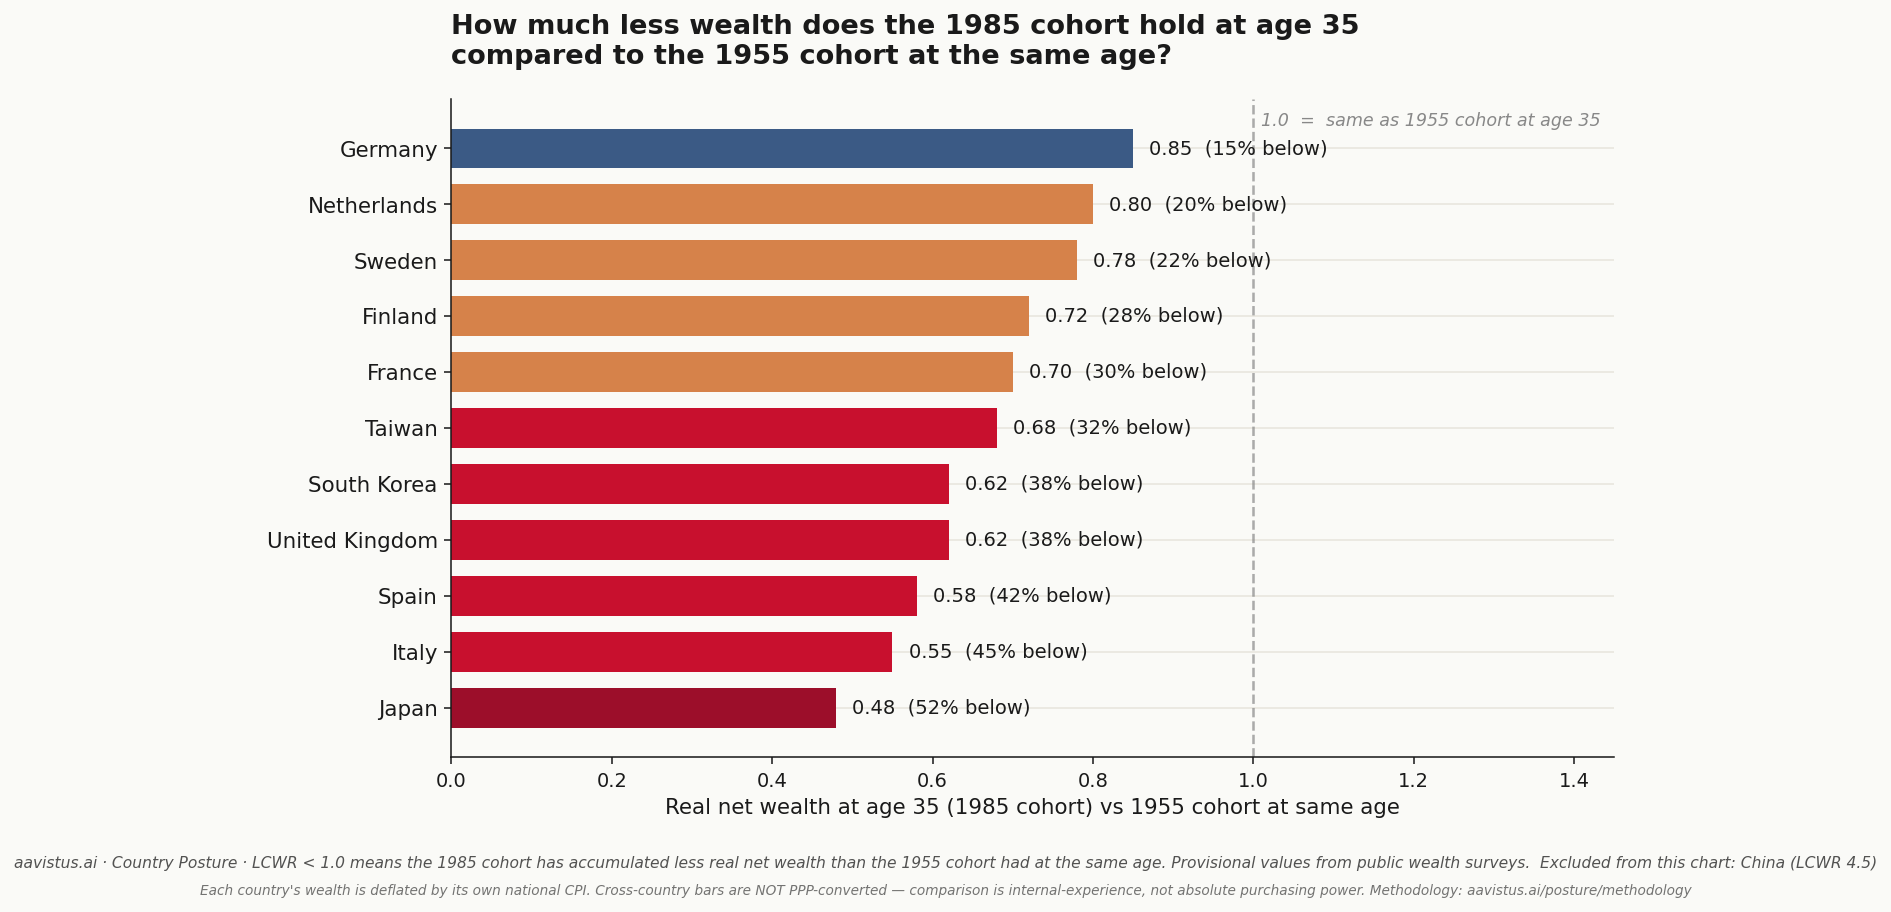
Read the methodology and bias audit before drawing conclusions from the headline. The directional claim — younger cohorts hold less wealth at the same age — is robust to every audit we can run. The magnitude of the gap is uncertain in either direction, and the methodology page documents which way each known bias pushes.
Cultural signals — the leading-indicator companion
We track an expanding catalogue of cultural vocabulary — hygge, tang ping, sōshoku-danshi, sampo, soft life, niksen, kotoilu, kalsarikännit and others — that legitimates reduced engagement with the work–strive–accumulate sequence. These terms are not synonyms: each carries its own cultural meaning, severity, and history. What's analytically interesting is that the catalogue itself is expanding, on a schedule that lines up with measurable structural pressure on the cohorts using it. See the dedicated page: A growing vocabulary for reduced engagement.
Why we publish this
Most country analysis is either deferential (IMF, OECD), short-term and narrative-led (bank macro research), or ideologically pre-positioned (think tanks). This work sits parallel: primary-source-grounded, calibrated, ideologically cross-cutting, leading-indicator-aware. Every structural claim logs a falsifiable prediction; every prediction is audited at 12 and 24 months on the public Track Record page.
The hard fiscal indicators that underpin the structural read — debt, deficit, revenue, interest burden — are published openly as Country Data.